Tutorial – How to use ChartJS Bubble chart with Django framework
August 26, 2021
Tiempo total: 2 días con 14:35:18 hrs
In this publication you will learn how to use Django Framework to render Bubble ChartJS, starting from cero.
Python Installation on a Windows Machine
Download latest Python:
https://www.python.org/ftp/python/3.9.6/python-3.9.6-amd64.exe
Install using custom installation:
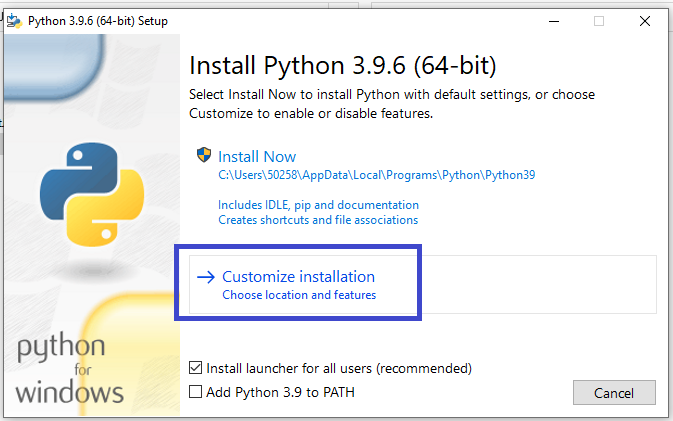
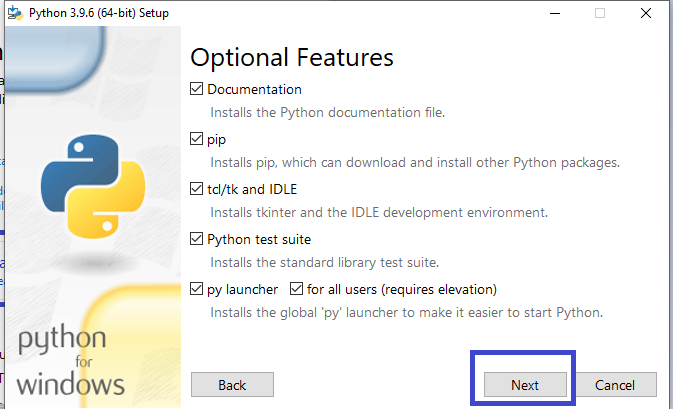
Click next:
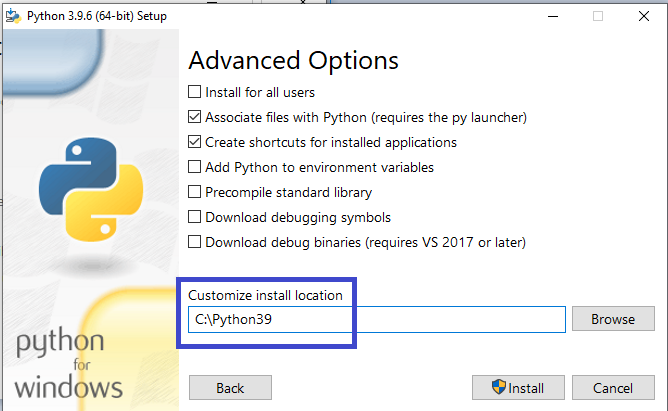
Set custom location path to:
C:\Python39
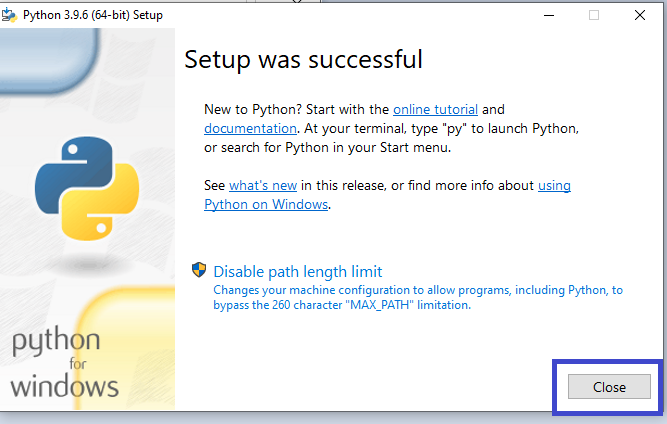
Close the installation wizard:
Update pip, install django and create a new project
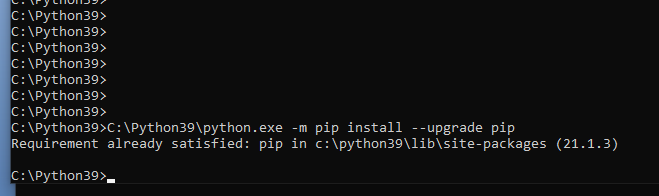
To update pip use next cmd command:
C:\Python39\python.exe -m pip install --upgrade pip
Configure your project to use a virtual environment, this is required to avoid install libraries on all system.
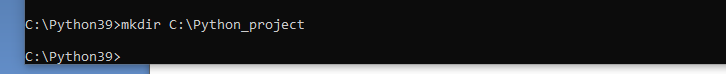
Create project folder:
mkdir C:\Python_project
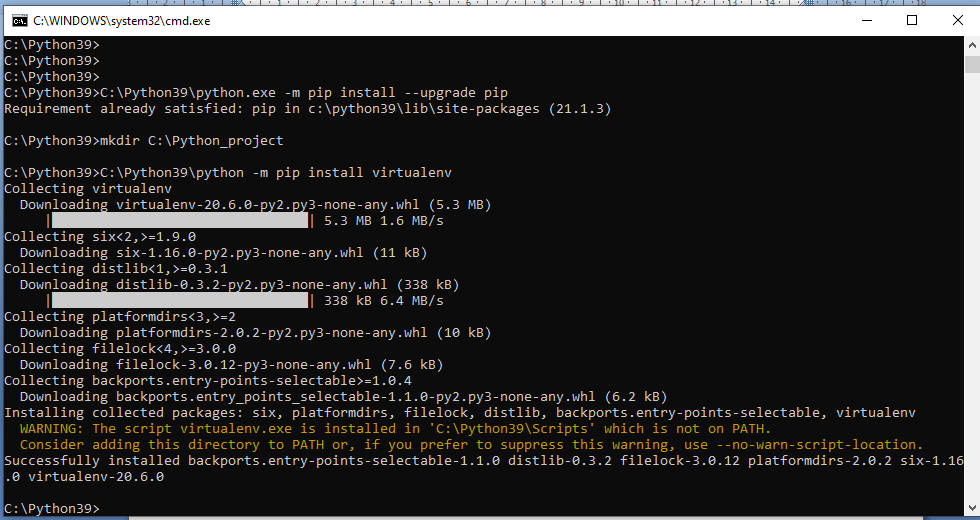
Install virtualenv:
C:\Python39\python -m pip install virtualenv
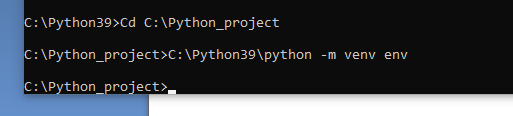
Create virtual environment in the project folder:
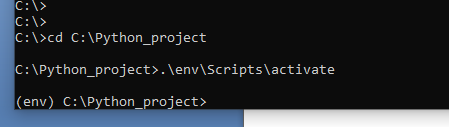
cd C:\Python_project
C:\Python39\python -m venv env
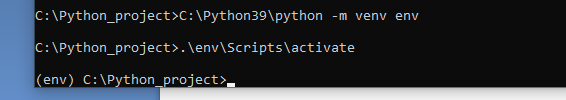
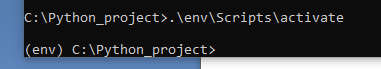
Activate the virtual environment.
Any library that you will install in a virtual environment will be installed only on that folder, not in the Python sytem.
.\env\Scripts\activate
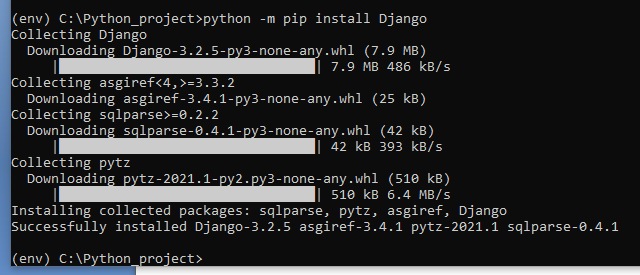
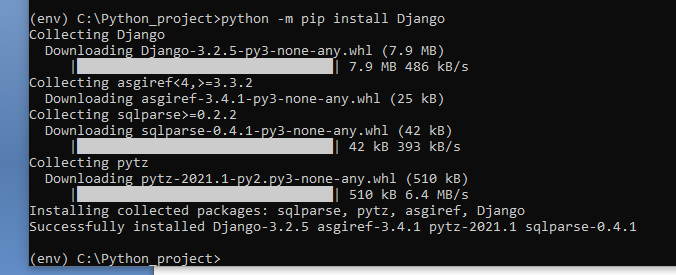
Now install Django (it will be installed only on the virtual environment):
python -m pip install Django
Create a new django project called “tutorial”
django-admin startproject tutorial
Install GIT
Download git from:
https://github.com/git-for-windows/git/releases/download/v2.32.0.windows.2/Git-2.32.0.2-64-bit.exe
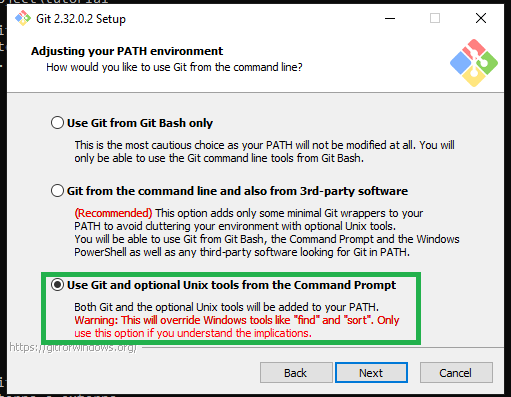
Install it. To use git in the Windows cmd select “Use git and optional Unix tools from the Command Prompt” on the window “Adjusting your PATH environment”.
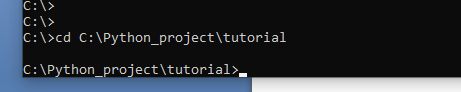
Now, close the cmd and open a new one. Go to project folder:
cd C:\Python_project\tutorial
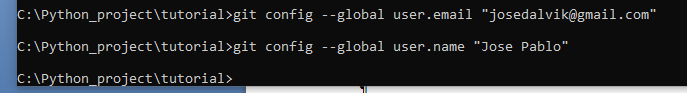
Set your email and name to identify your git work:
git config --global user.email "josedalvik@gmail.com"
git config --global user.name "Jose Pablo"
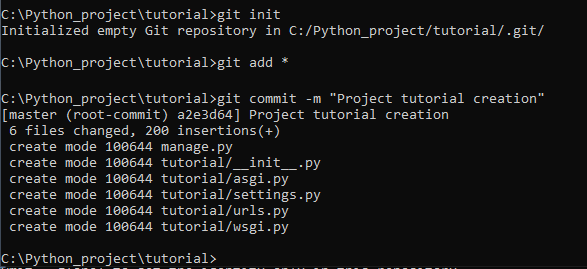
And create a git repository on the project folder:
git init
git add *
git commit -m "Project tutorial creation"
Create a new application
Enter to the root of the project, activate the virtual environment:
cd C:\Python_project
.\env\Scripts\activate
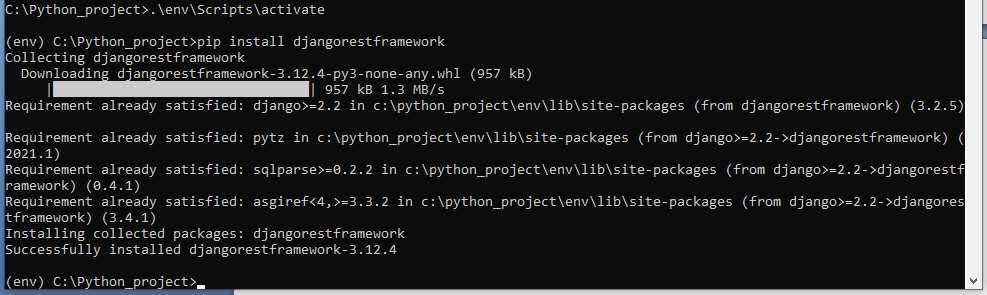
Install django rest-framework, this will let you handle POST, GET, PUT, DELETE and UPDATE html methods.
pip install djangorestframework
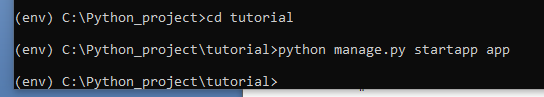
Enter to the project folder and create a new application called “app”:
cd tutorial
python manage.py startapp app
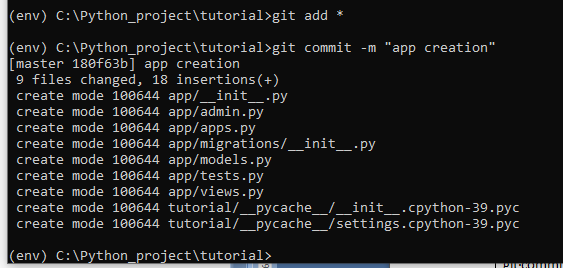
Commit changes:
git add *
git commit -m "app creation"
Edit Python files
To edit Python files you can use Visual Studio Code, download it at:
https://code.visualstudio.com/
Add Index page to new application
Configure the project to use the new application.
Modify the file:
C:\Python_project\tutorial\tutorial\urls.py
To load the new application route file:
from django.urls import path, include

urlpatterns = [
    path('', include('app.urls')),
]
Next step is to create “urls.py” file in the “app” folder.
File:
C:\Python_project\tutorial\app\urls.py
Copy the next code, it will load the index method at the root of the URL:
from django.urls import path
from app.views import index

urlpatterns = [
    path('', index)
]
Now, edit Views file and add an Index method.
File:
C:\Python_project\tutorial\app\views.py
Copy next code:
from django.shortcuts import render
from django.http import HttpResponse
from rest_framework.decorators import api_view

@api_view(['GET'])
def index(request):
    return HttpResponse("Hello world")
Commit changes:
cd C:\Python_project\tutorial\
git add *
git commit -m "Added Index page"
Adding data to model
The target is to retrieve next data from model:
| Id | X | Y | Size |
| 1 | 20 | 45 | 5 |
| 2 | 30 | 85 | 8 |
| 3 | 35 | 92 | 7 |
To create the model, modify next file:
C:\Python_project\tutorial\app\models.py
Add next code:
from django.db import models

class Position(models.Model):
    Id = models.AutoField(primary_key=True)
    X = models.IntegerField()
    Y = models.IntegerField()
    Size = models.IntegerField()
Add ‘app.apps.AppConfig’to the installed applications.
Edit next file:
C:\Python_project\tutorial\tutorial\settings.py
Should look like this:
INSTALLED_APPS = [
'django.contrib.admin',
'django.contrib.auth',
'django.contrib.contenttypes',
'django.contrib.sessions',
'django.contrib.messages',
'django.contrib.staticfiles',
'app.apps.AppConfig'
]
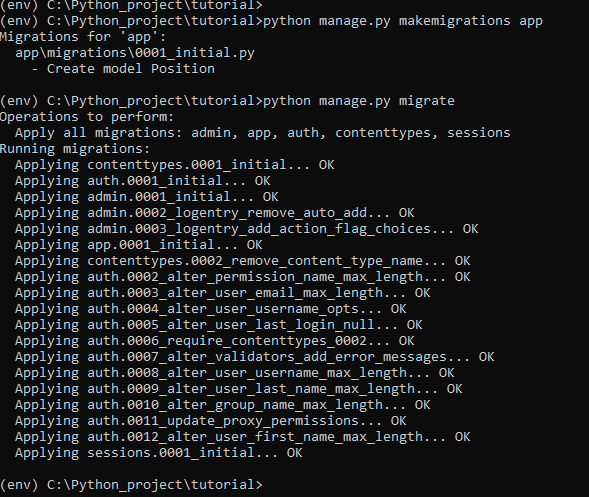
The next command will create the table “Position” using sqlite:
python manage.py makemigrations app
python manage.py migrate
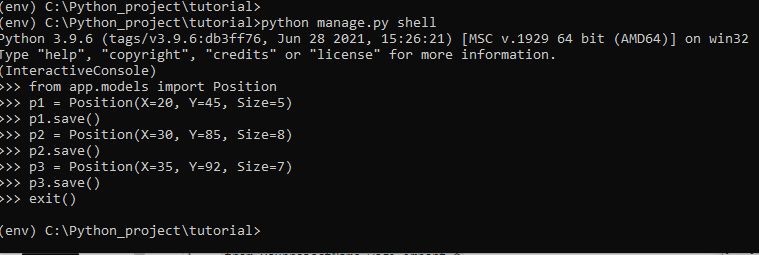
Now insert values on the database using next cmd commands:
python manage.py shell
from app.models import Position
p1 = Position(X=20, Y=45, Size=5)
p1.save()
p2 = Position(X=30, Y=85, Size=8)
p2.save()
p3 = Position(X=35, Y=92, Size=7)
p3.save()
exit()
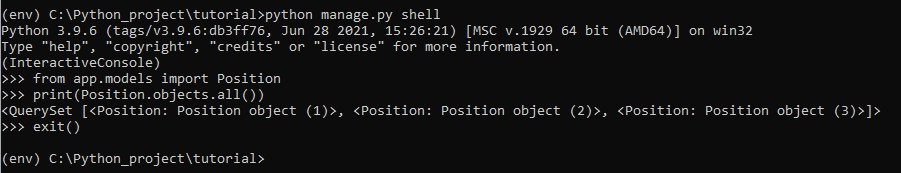
To verify inserted values, can use next commands:
python manage.py shell
from app.models import Position
print(Position.objects.all())
exit()
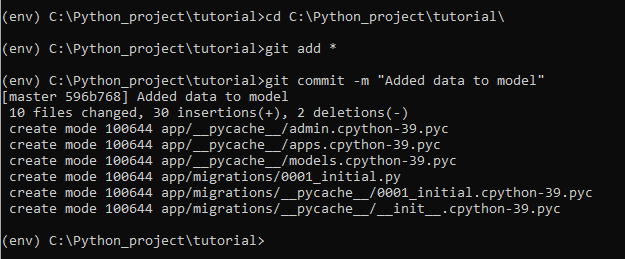
Commit changes:
cd C:\Python_project\tutorial\
git add *
git commit -m "Added data to model"
Render data from view
In the view file:
C:\Python_project\tutorial\app\views.py
Import the Position model:
from app.models import Position
Get all the files of the table into a variable and send it to the template file:
positions = Position.objects.all()
return render(request, 'index.html', {'positions': positions})
View file should look like this:
from django.shortcuts import render
from django.http import HttpResponse
from rest_framework.decorators import api_view
from app.models import Position

@api_view(['GET'])
def index(request):
    positions = Position.objects.all()
    return render(request, 'index.html', {'positions': positions})
Next step is to create a folder called “templates”:
mkdir C:\Python_project\tutorial\app\templates
Create a file called “index.html”:
C:\Python_project\tutorial\app\templates\index.html
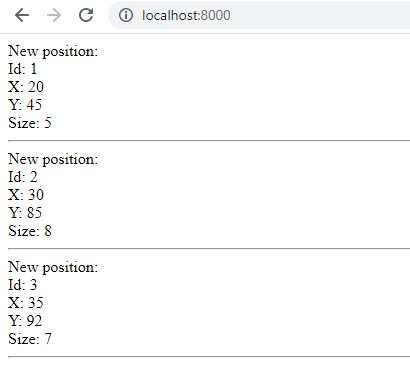
Add next content, as an example of how to print all data from the Position table:
{% for position in positions %}
    New position:<br/>
    Id: {{ position.Id }}<br/>
    X: {{ position.X }}<br/>
    Y: {{ position.Y }}<br/>
    Size: {{ position.Size }}<br/>
    <hr/>
{% endfor %}
Final result in the client web browser should be:
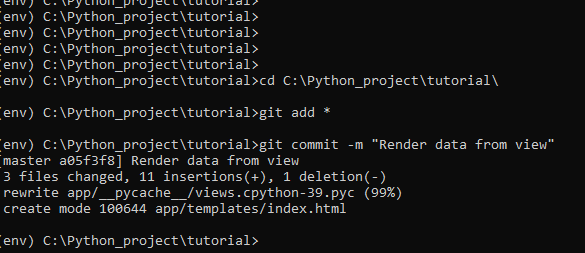
Commit changes:
cd C:\Python_project\tutorial\
git add *
git commit -m "Render data from view"
Serve static files from your templates
The project settings file:
C:\Python_project\tutorial\tutorial\settings.py
Should have in the Installed apps the value “django.contrib.staticfiles”
INSTALLED_APPS = [
'django.contrib.admin',
'django.contrib.auth',
'django.contrib.contenttypes',
'django.contrib.sessions',
'django.contrib.messages',
'django.contrib.staticfiles',
'app.apps.AppConfig'
]
Also, make sure that the global variable “STATIC_URL” has the next value:
STATIC_URL = '/static/'
Then, create a folder with next command:
mkdir C:\Python_project\tutorial\app\static
Download chartjs.js file from next URL:
https://cdnjs.cloudflare.com/ajax/libs/Chart.js/3.4.1/chart.min.js
And add it to the static folder:
C:\Python_project\tutorial\app\static\chart.min.js
Finally, to load the file in the template use next code:
{% load static %}
<script type="text/javascript" src="{% static 'chart.min.js' %}"></script>
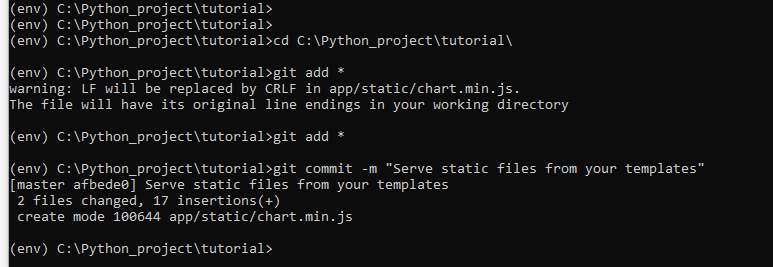
Commit changes:
cd C:\Python_project\tutorial\
git add *
git commit -m "Serve static files from your templates"
Using HTML page structure and render Bubble chart
According to the W3C standard, the basic structure for an HTML document is next:
<!DOCTYPE html>
<html>
    <head>
        <title>Page Title</title>
    </head>
    <body>

        <h1>My First Heading</h1>
        <p>My first paragraph.</p>

    </body>
</html>
To isolate the javascript code required to render the graph, add next file to the static folder:
C:\Python_project\tutorial\app\static\custom.js
So, in the header section of the template add next code:
<script type="text/javascript" src="{% static 'custom.js' %}"></script>
The template file:
C:\Python_project\tutorial\app\templates\index.html
Should look like this:
<!DOCTYPE html>
<html>
    <head>
        <title>Page Title</title>

        {% load static %}
        <script type="text/javascript" src="{% static 'chart.min.js' %}"></script>
    </head>
    <body>

        ... Graph code here

    </body>
</html>
Render the bubble graph
In the section of the html template, add next canvas element, wich will contain the bubble graph:
<canvas id="mygraph" width="400" height="400"></canvas>
The data to render the bubble graph is already available on the template file, to access to it use the variable called “positions”.
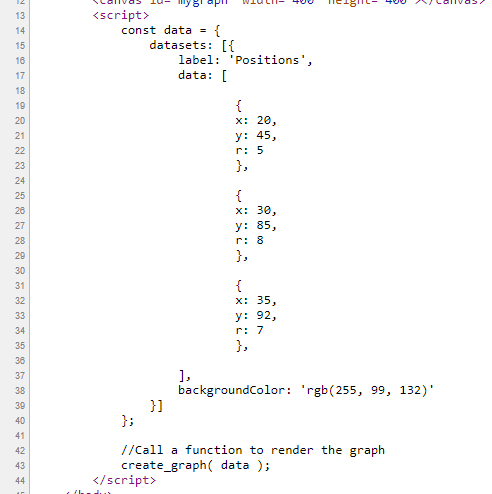
Combine python and html code in the template file to create a dynamic javascript object array:
    <script>
        const data = {
            datasets: [{
                label: 'Positions',
                data: [
                    {% for position in positions %}
                        {
                        x: {{ position.X }},
                        y: {{ position.Y }},
                        r: {{ position.Size }}
                        },
                    {% endfor %}
                ],
                backgroundColor: 'rgb(255, 99, 132)'
            }]
        };

        //Call a function to render the graph
        create_graph( data );
    </script>
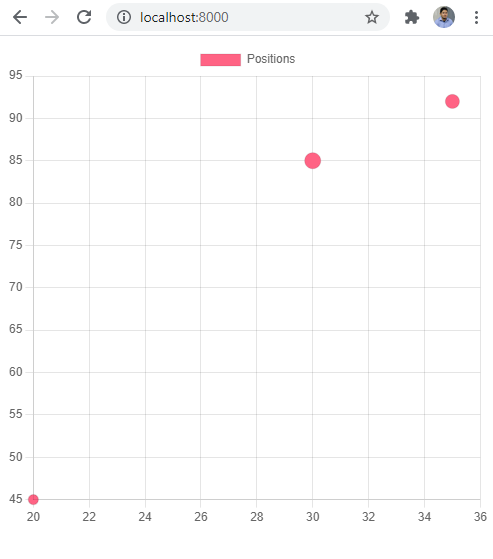
The rendered result of this code is:
Finally, modify the javascript file:
C:\Python_project\tutorial\app\static\custom.js
Add next function:
function create_graph(data_graph){
var ctx = document.getElementById('mygraph');
var myChart = new Chart(ctx, {
type: 'bubble',
data: data_graph,
});
}
The final result of the template file is the next:
<!DOCTYPE html>
<html>
    <head>
        <title>Page Title</title>

        {% load static %}
        <script type="text/javascript" src="{% static 'chart.min.js' %}"></script>
        <script type="text/javascript" src="{% static 'custom.js' %}"></script>
    </head>
    <body>

        <canvas id="mygraph" width="400" height="400"></canvas>
        <script>
            const data = {
                datasets: [{
                    label: 'Positions',
                    data: [
                        {% for position in positions %}
                            {
                            x: {{ position.X }},
                            y: {{ position.Y }},
                            r: {{ position.Size }}
                            },
                        {% endfor %}
                    ],
                    backgroundColor: 'rgb(255, 99, 132)'
                }]
            };

            //Call a function to render the graph
            create_graph( data );
        </script>
    </body>
</html>
The final result of the graph is the next:
Commit changes:
cd C:\Python_project\tutorial\
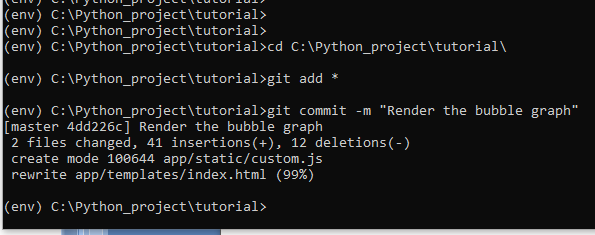
git add *
git commit -m "Render the bubble graph"
Improve the graph
To add a title and make the graph responsive add the next params to myChart variable at the file:
C:\Python_project\tutorial\app\static\custom.js
Code:
    options: {
      responsive: true,
      plugins: {
        legend: {
          position: 'top',
        },
        title: {
          display: true,
          text: 'Bubble tutorial'
        }
      }
    }
Also modify aspect ratio using width and height params of the canvas object at the template file:
C:\Python_project\tutorial\app\templates\index.html
Code:
<canvas id="mygraph" width="400" height="150"></canvas>
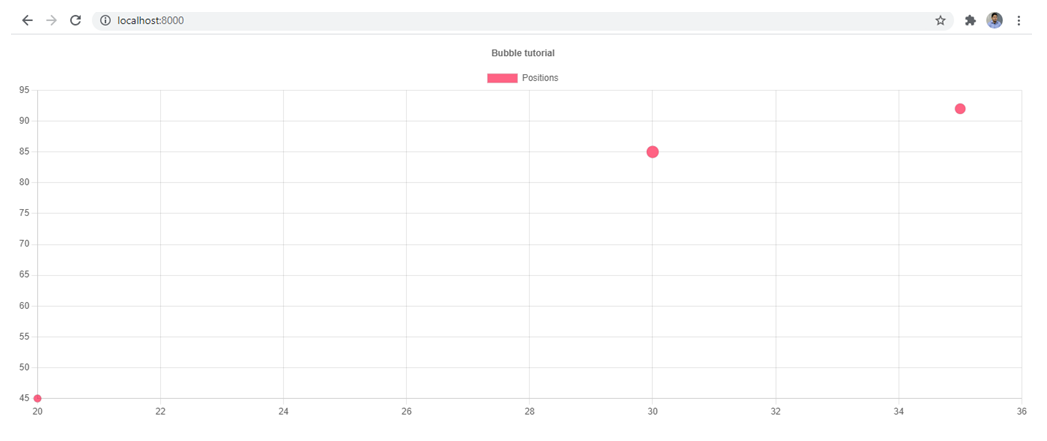
Final result:
Commit changes:
cd C:\Python_project\tutorial\
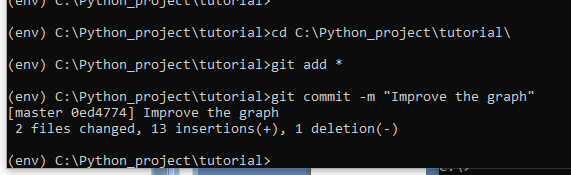
git add *
git commit -m "Improve the graph"
How to execute a Django web application?
When you turn on your computer, you need to go to the project folder, activate the virtual environment and run the django web application as a server.
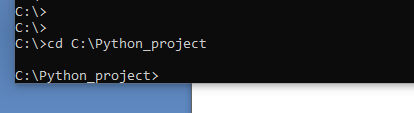
Step 1: go to project folder with Windows cmd:
cd C:\Python_project
Step 2: activate the virtual environment.
.\env\Scripts\activate
Enter to the project folder and run python test webserver:
cd tutorial
python manage.py runserver
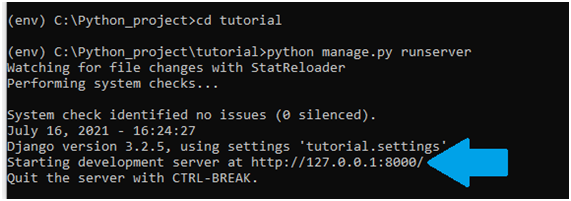
Now you can access to localhost using a web browser:
http://127.0.0.1:8000